- Vrealmatic
- Unreal Engine Wiki
- Profiling
Performance Profiling in Unreal Engine
How to track and identify performance problems in the Unreal Engine?

Frame Render Time
When we talk about an optimal performance of an running app, we usually talk about the FPS. FPS (Frames per seconds) or a Frame Rate is a metrics that tells us how many frames is rendered within a single second. Although FPS value is clear, the more useful information for us developers is the exact render time. After all, based on this number the FPS is calculated. Simply:FPS = 1000 ms / Frame Render Time in ms.
Common fps rates in milliseconds (1 second = 1,000 milliseconds)
| FPS | Calculation formula | Frame render time | Typicall Game genre |
|---|---|---|---|
| 30 FPS | 1000 / 30 | 33.33 ms | cinematic adventure |
| 60 FPS | 1000 / 60 | 16.67 ms | fast-paced action |
| 90 FPS | 1000 / 90 | 11.11 ms | VR product |
When developing an appliaction, based on its kind and usage, there's need to select maximum frame render time (= minimum running FPS) and develop it so to achieve a state when each frame is being rendered within this specified limit. That means, that within that time, the engine needs to process all game code, audio code as well as graphics rendering. These processes are split between CPU and GPU(s):
- CPU - something like a manager who preparing data and issues commands (draw calls) for the the GPU through an API such as OpenGL, DirectX, Vulkan, Metal or so.
- GPU - processes draw calls into the frame rendering
The difficulty of each process (how much time it takes) can then be tracked using so-called performance profiling. More detailed information about achieving smooth graphics performance in Unreal Engine-based projects can be found at Unreal Art Optimization gitpage.
Performance profiling
Performance profiling let us to take a look at each aspect of a frame rendering. Within a timeline, we can check total render behaviour within the single frame rendering in a spectrum of each processed task. By that way, we exactly know when what task starts, how long it takes and so on.
General Preparation for profiling
As we need to get performance profile of an actual state more than of a theoretical overview, we need to do the profiling with a setup close to the real app and its usage. That basically mean following:
- Place cameras where typically the player would enter and what he will have in view (
Perspective → Camera Actor) - Set resolution near to real game's resolution (arrow near the Play button →
Advanced Settings→ Specify the resolution for the game to run in in thePlay in New Windowoption) - To get accurate results, be sure that there is disabled
Smooth Frame Rateoption that just snaps the frame rate to stable values like 30, 45, 60 fps. This option can be controlled atProject Settings→General Settings→Framerate→ checkboxSmooth Frame Rate.
Displaying measuring metrics
Metrics about rendering cost can be activated and displayed right in the Unreal Editor through the console with console commands.
Console commands can be inserted right to the editor console window or also right inside the play mode after pressing ~ key.
Many these stats can be displayed also through Viewport Options → Stat → Advanced and Engine tab.
Identification of the problematic thread
Console commands stat unit / stat unitgraph
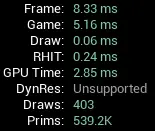
| Metric | Description | |
|---|---|---|
| Frame | The total amount of time spent generating one frame of the game. | |
| Game | Time spent on the game thread. It's the work of the CPU on the gameplay code. If the value is close to the Frame Time, then the game's performance is most likely bottlenecked by the Game Thread. | 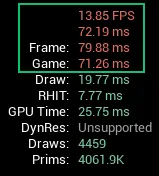 |
| Draw (Rendering) | Time spent on the rendering thread. It's the work of the CPU on preparing data for the graphics card. If the value is close to the Frame Time, then the game's performance is most likely bottlenecked by the Rendering Thread. | |
| GPU | Raw time spent on the GPU rendering the frame. GPU time is synced to Frame Time, so they are likely to be similar. If neither time is close to Frame Time while GPU time is close, then you are bottlenecked by the video card. | 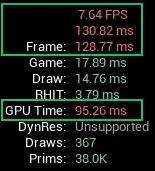 |
| RHIT | Time spent on the Rendering Hardware Interface Thread (e.g. OpenGL, D3D12). Likely similar to the frame time. | |
| DynRes | If supported, displays the current DynaRes resolution. | |
| Draws | The current amount of DrawPrimitive calls. | |
| Prims | The current amount of triangles being drawn. | |
stat unitgraph command prints the same information, but also starts displaying a graph. It's useful when moving or flying through the scene, because it makes it easier to locate heaviest places or situations.
Note: Work on the next frame can't begin until the current frame is finished and displayed. If one of the components takes more time than others, causing Frame to exceed the desired limit, it becomes a bottleneck.
Recording performance metrics
All metrics can be recorded into logs. There are 2 commands to control the recording:
stat startfile- to start record the datastat stopfile- to stop record the data
There's a message about the log duration in the upper left corner during recording. After stopping the recording, the stat file is saved at project's folder, section Saved/Profiling/UnrealStats.
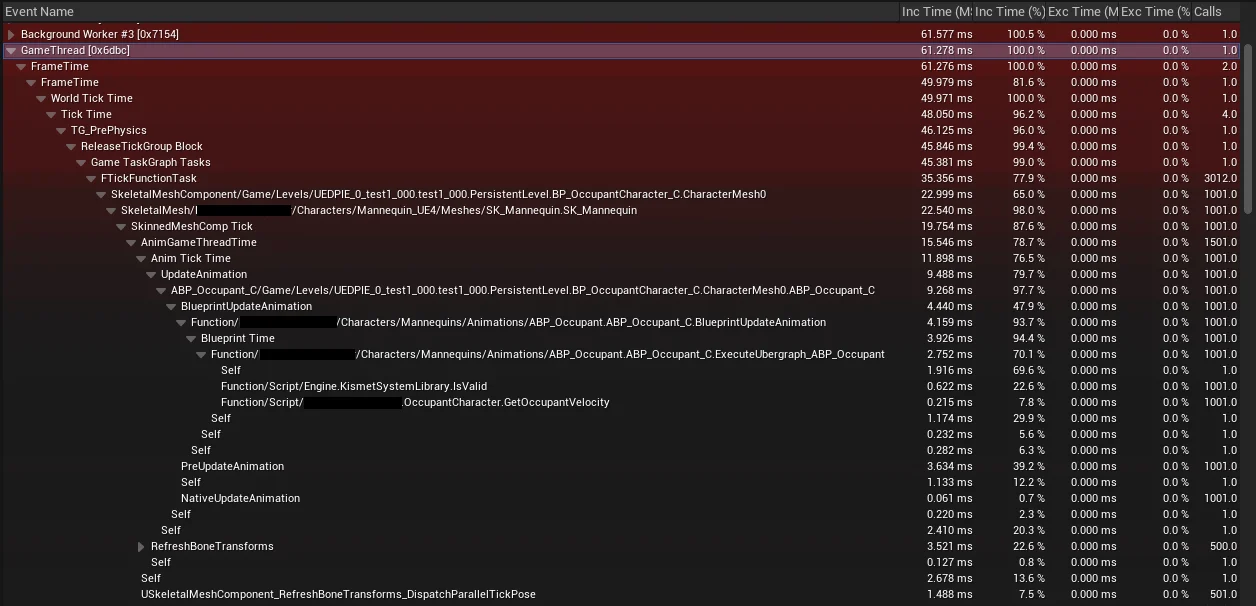
Session Frontend Viewer
Recorded stat file can be loaded through Window → Developer Tools → Session Frontend, see Using the Unreal Frontend tool. Note that this option cannot be available when using VSCode as a default editor. In such case, there's still possible to open the tool as standalone application located at EpicGames/UE_X.X/Engine/Binaries and then based on your OS either Win64 / Mac... directory - search for UnrealFrontend application file.
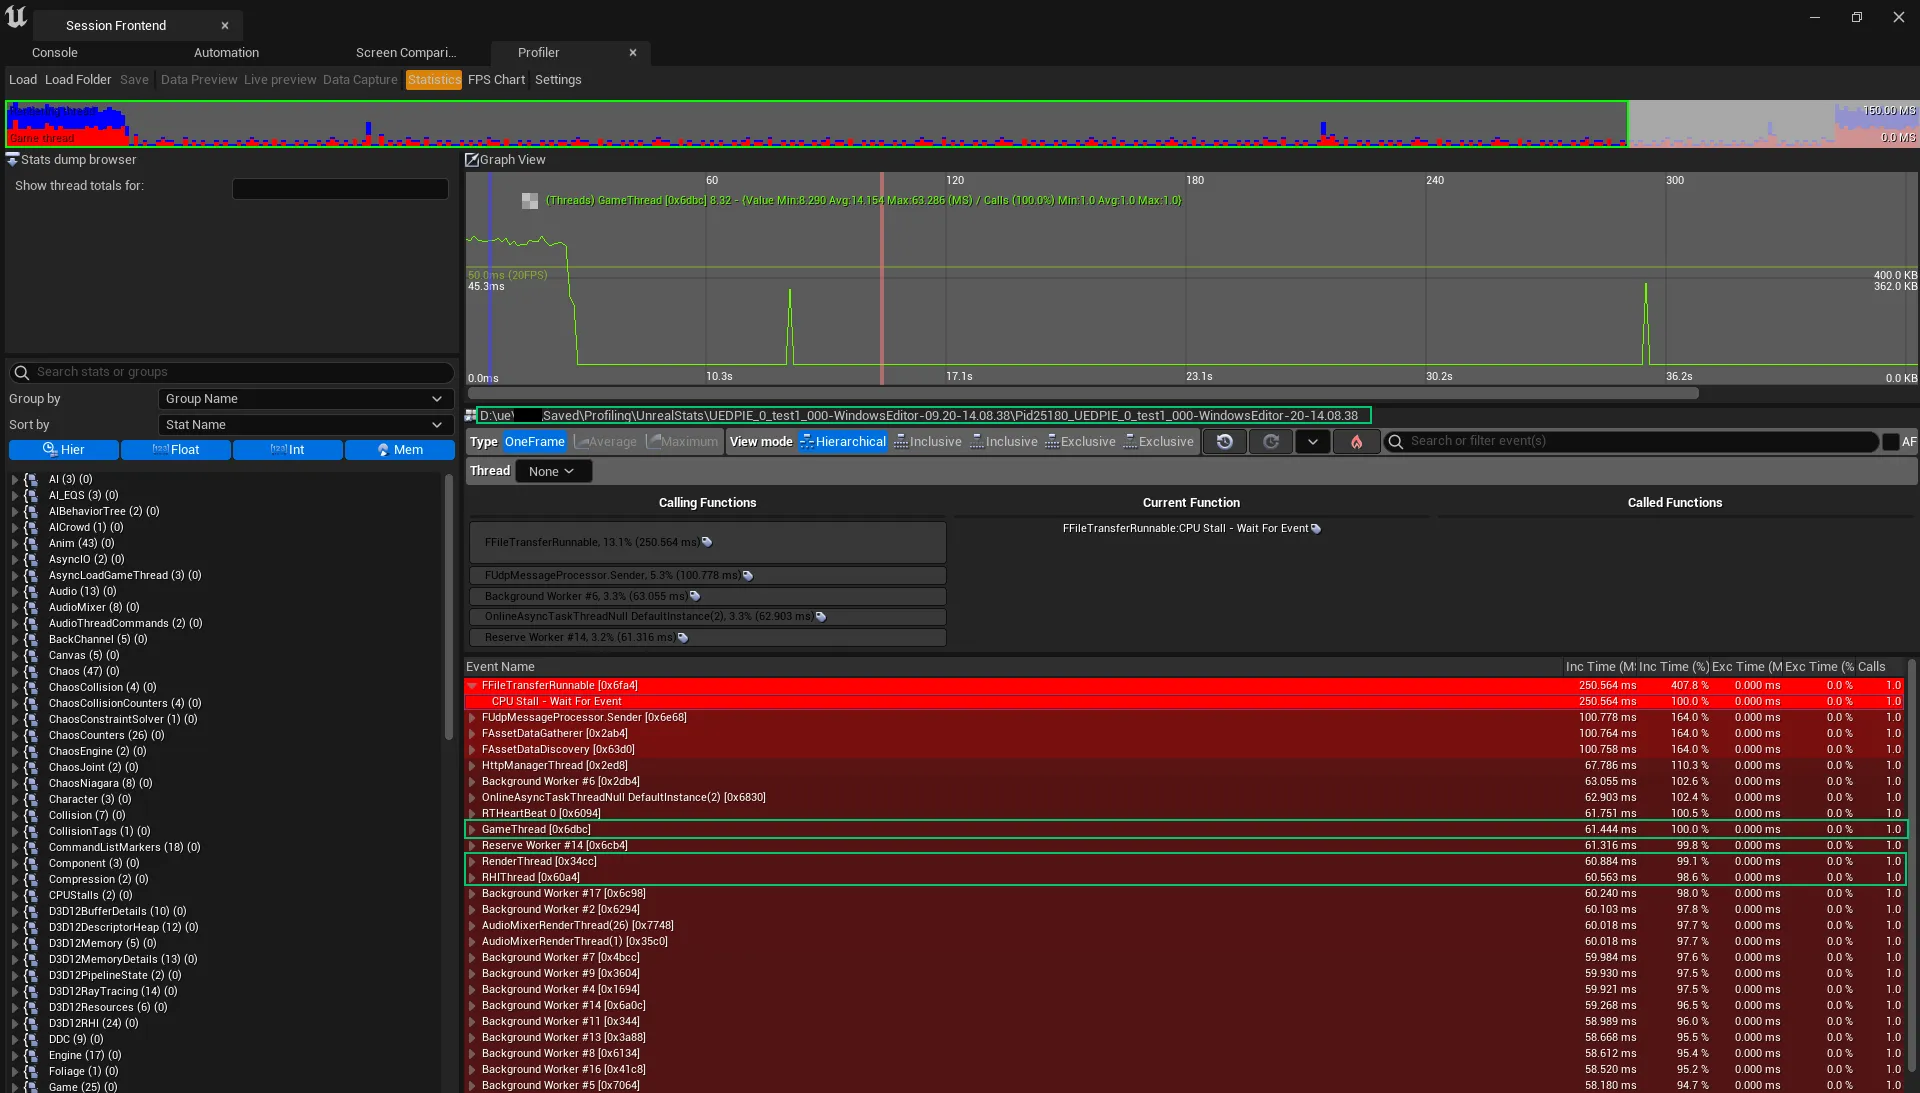
The stats include CPU and GPU stats at the same time, each in its own sidebar category.
As marked, there can be found thread such as Game, Render, RHIT and so. All the threads can be unfolded for detailed look at all the processed tasks in the thread.
Other Console commands
stat fps- shows FPS and frame render timestat gpuStat GPU splits the time of rendering a frame into specific passes. It's like a simplified, text version of GPU Visualizer.
stat InitViewsIt helps with measuring the cost and effectiveness of occlusion and frustum culling. Both are techniques used by game engines to improve performance - they dynamically hide meshes that would be invisible from the camera's position.
View Visibility, Occlusion Cull- Cost of performing culling.Processed primitives- All objects that were considered, before culling.Frustum Culled primitives- Object that were out of camera's cone of view.Occluded primitives- Objects concealed from camera's view by other bigger objects
stat RHIstat RHIstands for Rendering Hardware Interface3. This command displays several unique statistics:- Render target memory Shows the total weight of render targets like the GBuffer (which stores the final information about lighting and materials) or shadow maps.
- Buffers' size depends on game's rendering resolution, while shadows are controlled by shadow quality settings.
- It's useful to check this value periodically on systems with various amounts of video RAM, then adjust your project's quality presets accordingly.
- Triangles drawn shows the final number of triangles after frustum and occlusion culling.
It may seem too big compared to your meshes' polycount. It's because the real number includes shadows (that “copy” meshes to draw shadow maps) and tessellation. In the editor it's also affected by selection.
- DrawPrimitive calls shows the amount of draw calls issued in current frame (excluding only the Slate UI). This is the total value, so besides geometry (usually the biggest number) it also includes decals, shadows, translucent lighting volumes, post processing and more.
- Render target memory Shows the total weight of render targets like the GBuffer (which stores the final information about lighting and materials) or shadow maps.
stat scenerendering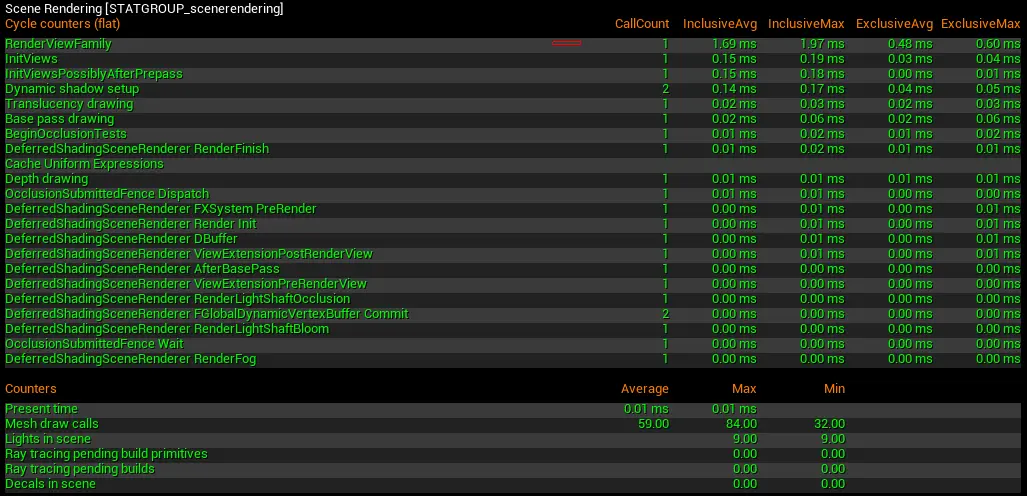
stat Foliage- Stats related to all instanced static meshes (not only foliage). Shows number of instances and total triangle count.stat Landscape- Number of triangles and draw calls used to render all landscape actors.stat Particles- Number of particle sprites, among other info.stat LightRendering- Cost of lighting, number of lights affecting translucency lighting grid, shadow-casting and unshadowed lights.stat ShadowRendering- Cost of shadow casting. Total memory used by shadow maps.stat engine- General render information
GPU Visualizer
A built-in tool that is showing a breakdown of the work done by the GPU on a single frame into specific sections, like shadows or transparency. It can be opend by pressing Ctrl + Shift + , as well as through profilegpu console command when the game is running in the editor.
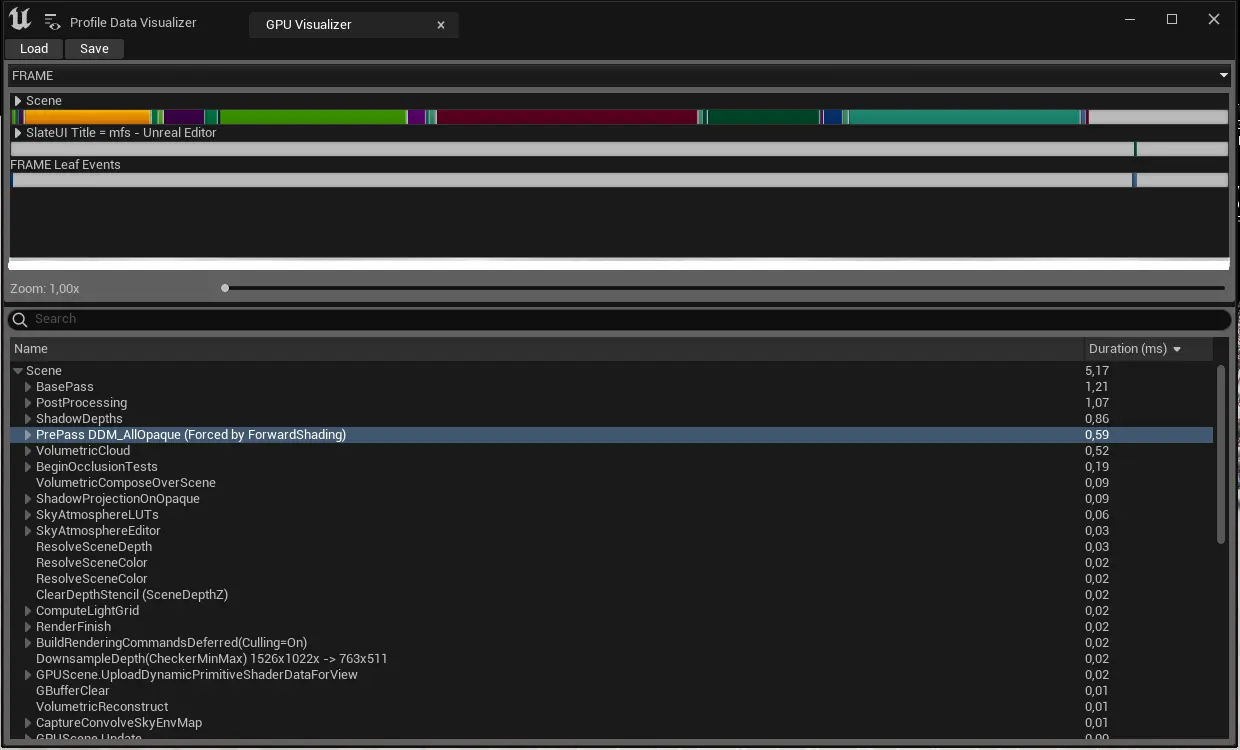
GPU Visualizer properties:
- It has very precise categories like: BeginOcclusionTests, ShadowDepths, RenderVelocities.
- It does not provide the cost of specific meshes or specific typical lights (Only lights with shadows can be found in the GPU Visualizer)
Visible way of measuring LODs
Through the View Mode (Lit in default), there's option Level of Detail Colorization → Mesh LODs / Hiearchical LODs that activates recoloring of meshes based on their LOD.